The board view
One board, and whether it is behaving like the board its profile says it is.
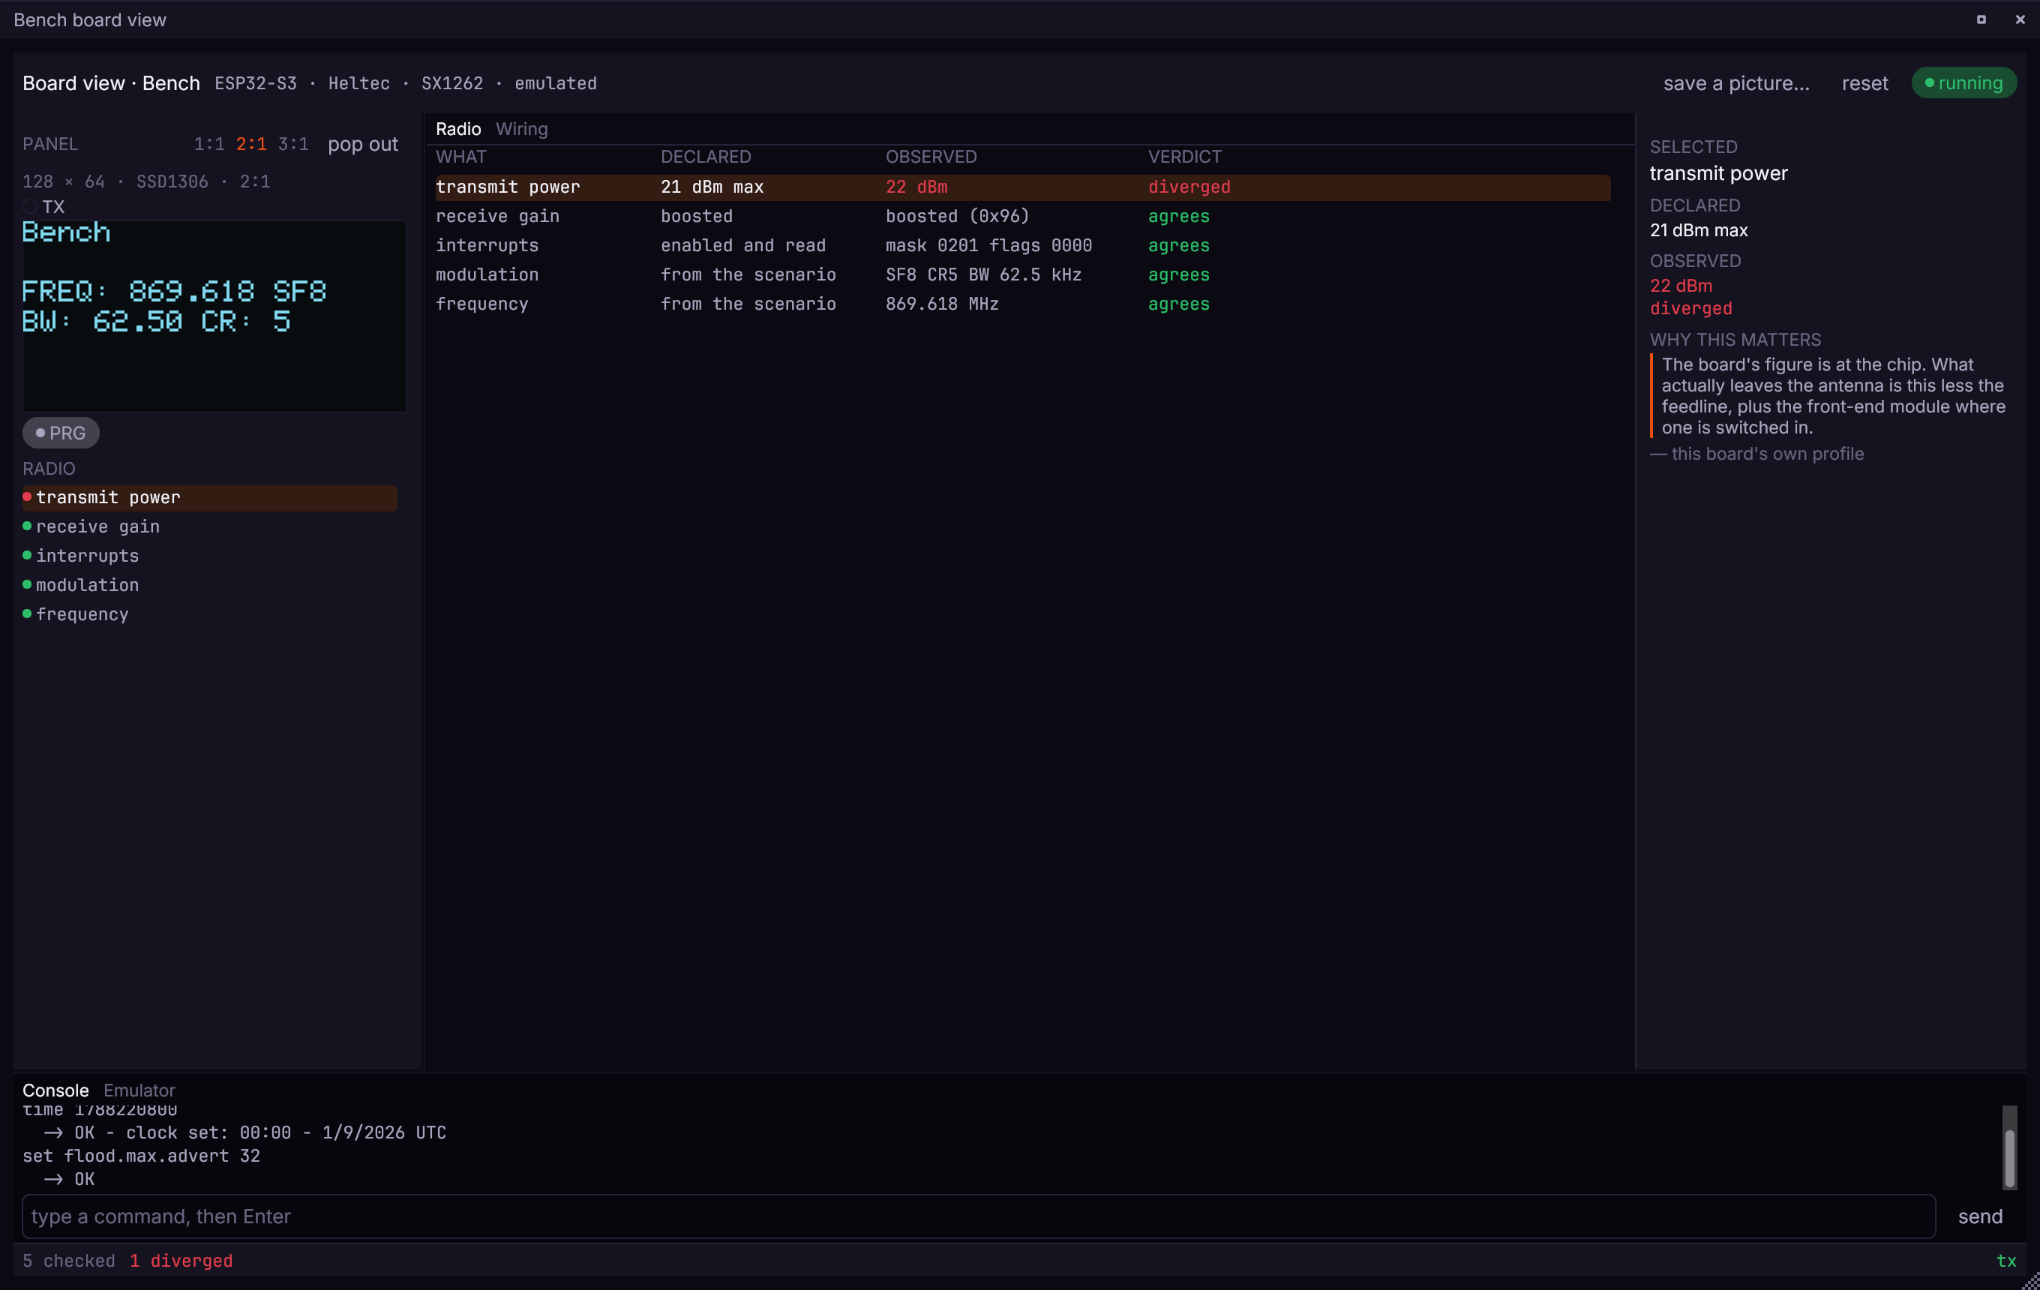
The Hardware tab in a node's own window draws a board so somebody can recognise it and press its buttons. That is what an operator and an application developer need. The board view asks a different question, for the person who already knows what the board is and cannot change it: does the thing in front of them match its own declared wiring, and if not, which line is lying.
It is a window rather than a tab because the move it exists for is "the log said this, so what did the pin do", and that needs the log and the table on screen at once.
Opening it#
A node must be running an emulated board image. Native builds are the host's own binary and have no board behind them, so there is nothing for the window to compare.
- From the interface. Open the node's window, go to the Hardware tab, and press the button for the board view.
- From a script.
node.boardview, orwb.board_view(node)in the Python and Go clients.tabpicks which table it opens on, and a name that is neither is refused rather than quietly opening the default.
wb.board_view("Abernethy Repeater")
wb.board_view("Abernethy Repeater", tab="Wiring")One window per node. Asking again for a node that already has one brings the existing window back rather than opening a second copy, which is also how a window dragged off the edge of a screen is recovered.
The four regions#
The panel and the parts index, on the left. The board's own display at a whole-number scale, with every part the profile declares listed underneath as an index. Picking a part in the index selects its row in the table.
The controls, beside the panel. Everything on this board that can be driven: its buttons, its trackball, its keyboard, the card in its slot, its touch layer.
The tables, in the middle. Two of them, Radio and Wiring.
The inspector, down the right. What the selected row means: its declared and observed halves again, and the board profile's own account of why the row is worth having.
The console, along the bottom. What the board printed and what its emulator said, with a box to type at it.
Along the top, the board is named with what it is: its microcontroller, its vendor, its radio, and whether it is emulated. save a picture... writes the panel out as an image, reset restarts the board, and the pill says whether it is running.
Along the bottom, a count of what the open table concluded: 8 checked, 1 not modelled. That line is the window's summary, and a table with nothing but agrees on it says so there.
The panel#
The display is drawn at whole multiples of its own resolution: 1:1, 2:1, 3:1. Steps rather than a zoom, because those are the only honest sizes. A continuous control would offer a hundred positions of which three show the firmware's pixels and the rest show an interpolation of them.
The line under the panel says what it is and how it is being drawn:
128 × 64 · SSD1306 · 2:1
The scale is part of that line because a panel at 1:1 and the same panel at 2:1 are different evidence, and nothing else on the screen would say which is on show.
What is drawn is what the firmware drew, and nothing else. There is no backlight, no viewing angle and no refresh artefact, so a panel here is cleaner than the one on the desk.
A panel that is off after an idle is not a fault: the firmware switches it off and the board's own button brings it back. The Display row says asleep rather than reporting nothing.
The panel can be given a window of its own, which is what to do when the board is being watched rather than driven.
Driving the board#
Buttons and the trackball are pressed from the controls beside the panel. A press moves the real pin, under either emulator.
The keyboard goes to whatever has focus. Click the panel first, then type, and the keys reach the board's own keyboard. The caption beside the control says so rather than leaving it to be discovered, because a keyboard that silently needs a click first is one somebody concludes is broken.
A tap is turned before it is sent. Where a panel is mounted rotated, a touch is rotated back to the coordinates the firmware expects, or every tap lands somewhere else.
No control is offered for a part nothing models. A board's battery meter has no slider, because nothing models the converter behind it and a slider setting a voltage the firmware cannot read would be a control that lies. The Wiring table says so on that row instead.
The tables#
Radio#
The comparison that answers today. Every row is something the firmware really left in the chip's registers, beside what the board's profile claims it should be.
| row | what it compares |
|---|---|
| transmit power | what SetTxParams asked the PA for, against what the board's chip can do |
| frequency | the chip's tuned frequency against the board's declared band |
| modulation | spreading factor, bandwidth and coding rate as the firmware set them |
| receive gain | register 0x08AC: 0x96 boosted, 0x94 power saving |
| interrupts | the mask the firmware enabled, and how many fired |
| spurious interrupts | deliberately injected false detections, on the faulty-radio preset |
The transmit power row is worth reading closely. The board's figure is the power at the chip. What leaves the antenna is that less the feedline, plus the front-end module where one is switched in.
A build compiled for another region asks for less power without saying so, and this row is where that shows.
Wiring#
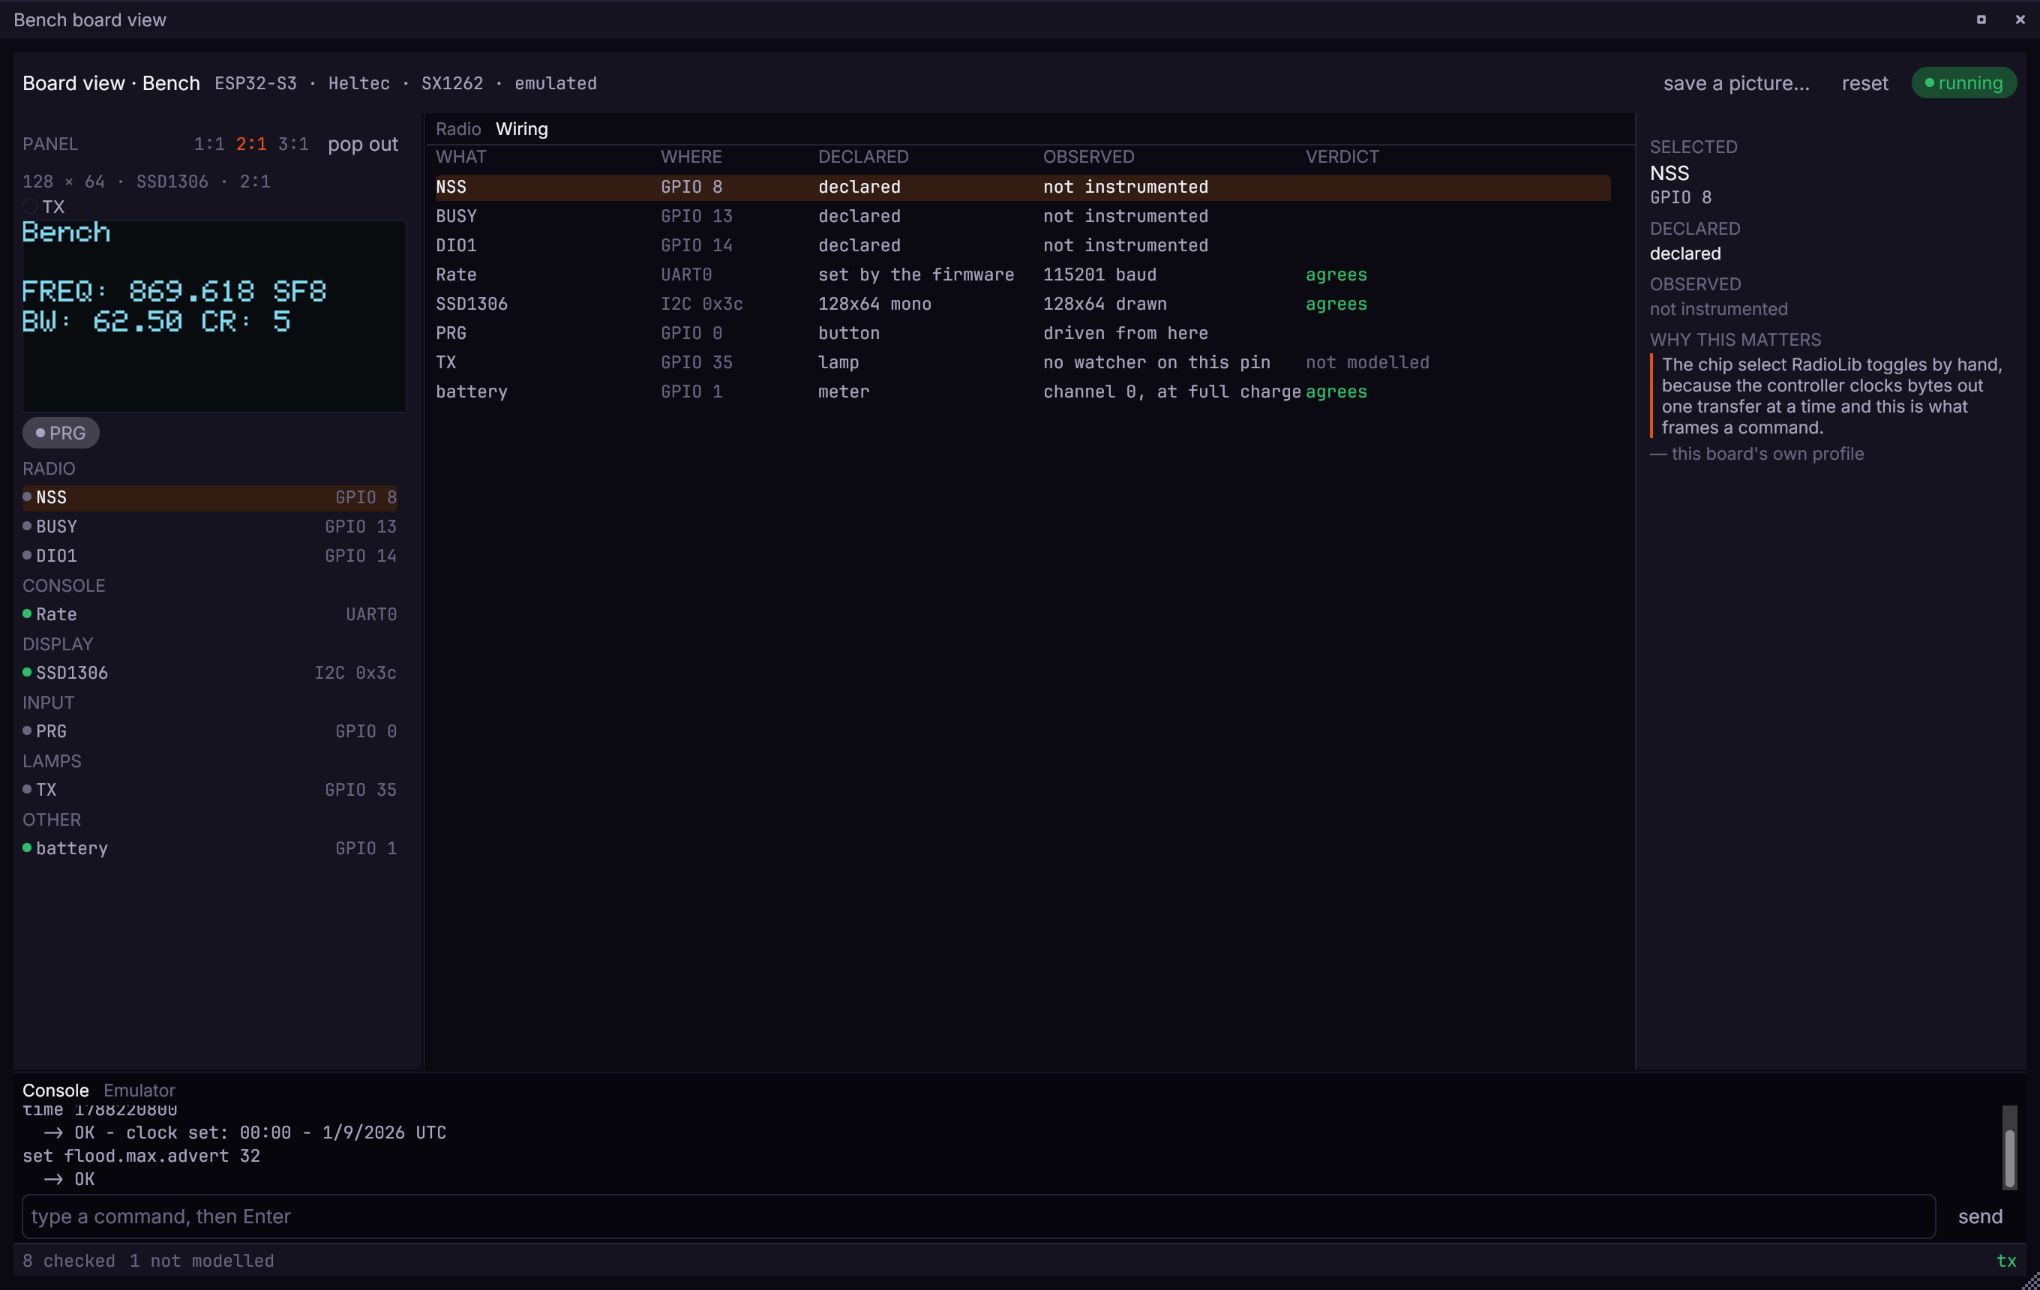
What the board declares it is wired as. Most rows read not instrumented, because nothing watches most GPIOs, and that is stated rather than printed as a dash somebody would read as "low".
The rows that do come back are the ones something reads: the front-end module's enable line, the display, the parts that are driven, and the console.
The console rate#
Under Console on the Wiring table, the rate the board's console is running at.
The rate is not a setting. It is the divider the firmware wrote into the chip's own UART, handed back with the radio's other registers, so the row is a reading rather than a preference. A firmware that changes its mind mid-run changes what is printed here.
| what it says | what it means |
|---|---|
115201 baud | the firmware asked for this. The figure comes through an integer division, so it lands beside a round number rather than on it |
no line rate | this board's console is the USB device, which carries packets rather than a bit stream |
nothing reported | the board is running and the emulator is older than the field |
not running | the board has not been started |
Take the reading after the board has settled. The ROM bootloader and the application need not agree about the rate, so a figure read during boot may be one nothing is using by the time anybody looks.
The rate assumes the UART is clocked from the APB. An ESP32's UART can be driven from the crystal instead, and which one it is lives in a register the emulator does not read, so a firmware that chooses the crystal is reported at twice the rate it set. Nothing in the row says so, which is the honest reason to treat a figure that is exactly double a rate you recognise as this rather than as the firmware doing something strange.
A board whose console is on USB reports no rate, and that is not a gap. USB carries framed packets and the rate a host asks for is discarded at both ends, so a number here would be an invention. Such a board's UART0 is still running, because the ROM bootloader prints there, but what it is doing is not the console and the row does not quote it as though it were.
Verdicts#
Every row carries one. The two interesting answers are both about an absence, and keeping them apart is what the window is for.
| verdict | meaning |
|---|---|
agrees | declared, and the firmware is using it as declared |
diverged | the firmware left it as something the board did not declare. The only one that is a fault on sight |
silent | declared, and nothing has come back. A button nobody pressed is silent and correct |
not modelled | there is no model for this part, so there is nothing to observe. About MeshBench, not about the board |
| blank | nothing observable is claimed for it yet |
A lamp is drawn as an outline rather than as an unlit lamp for the same reason: "off" and "not modelled" are different facts, and the second is a statement about the simulator.
The inspector under the selection gives the board profile's own account of what the row does, including what it would take to tell a silent row from a broken one.
The console#
Two voices, a tab apart, because they answer different questions.
Console is what the firmware chose to print. Emulator is what QEMU or Renode said about running it. A board that says nothing on one and a great deal on the other has already told you which half of the problem you have, and the emulator's half is invisible from inside the guest, which is exactly when it is needed.
The tab is labelled Emulator rather than QEMU or Renode because which one is running follows from the board's microcontroller rather than from any choice, and the window reads the same either way.
The strip follows the newest line until you scroll up, and follows again the moment you scroll back to the bottom. A board that is talking produces a line every few hundred milliseconds, and a strip that had to be dragged after each one would be unreadable.
The strip is resized by dragging the rule above it. It grows and the table gives way, between 56 and 460 dp. The floor holds the two tabs and a line: a strip shrunk past that could not be read or grabbed again.
last 40 of 3812 in the corner says what is on screen against what the file holds, so a tail does not read as the whole of it. The node window's Output tab is where the whole of it lives.
Sending a command#
The box along the bottom takes a line and sends it on Enter, or on send. The box clears, and the line appears in the console.
It is there on both tabs. The tabs choose what is being read and the box chooses what is sent, which are different questions.
What is accepted depends on what the node is, and the box routes for you.
- A repeater reads typed text. Its vocabulary is the firmware's own console.
- A companion speaks a framed protocol whose command line is meshcore-cli's vocabulary:
advert,floodadv,public <msg>,chan <n> <msg>,infos,ver,contacts,sync_msgs,set,time. There is nosend.
Text typed at a companion through a repeater's console is echoed locally and goes nowhere, which looks exactly like a command that ran and did nothing. The box will not do that to you.
Nothing is echoed twice: the line is written into the console buffer before the bytes reach the board, so what appears is the board's own record rather than a copy from the interface.
Decoding a companion#
A companion's serial carries the framed protocol, so read a byte at a time it is a wall of escapes with the answer buried in it. Typing ver at one shows the board name and the firmware version legible inside them.
The decode tick reads those frames out. MeshCore's framing is > from the node or < towards it, a little-endian length, then a payload, and each payload is decoded and printed as a line:
<- self: "C4894FDF" at 0.00000,0.00000, 869.618 MHz SF8 CR5, 22 dBm
That single line carries the board's name, position, frequency, spreading factor, coding rate and transmit power, none of which is readable in the escaped form.
What is not a frame stays as it was. A board prints plain text on the same port it frames on, so the bootloader and any error it logged sit beside the decoded frames rather than being replaced by them. The bootloader is what says whether the board started at all, and a decode that hid it would cost more than it gave.
A response this build does not recognise is still printed, by number rather than by name. The firmware gains responses faster than anything tracks them, and a decoder that drew nothing for an unfamiliar frame would be least useful exactly when something new is happening.
It is off by default, and the wire is what shows. That is still what the board actually sent, and this window is about what the board actually did. The tick appears only where there is something framed to decode, since a tick offering to make plain text readable could only puzzle whoever found it.
The window itself#
The board view is one of the workbench's pop-out windows, and behaves as the node, firmware and output windows do.
- Drag it by its title bar.
- Maximise from the title bar, and again to come back to the size it was. It fills the screen it is on.
- Resize by the grip in the bottom-right corner.
- A window that opens taller than the screen is fitted to it as soon as the screen is known, leaving room at the edges so the title bar stays reachable.
Under a Wayland compositor these windows are layer surfaces, which the compositor neither decorates nor resizes. The title bar and the grip are the window's own, which is why they are there rather than the desktop's.
Whether a pop-out window stays above the main one is a setting, read when the window opens.