Debugging packet delivery
The event log records a cause for every reception and every failure, so the question has an answer rather than a theory.
The workflow is a loop: a packet failed, find it on the timeline, read its cause, follow the cause to the panel that explains it, change the one variable it points at, and rerun. Because runs are deterministic, the rerun is an answer: same seed, same scenario, only your change differs.
Start in the Debug view#
It arranges the panels this question needs: the packet timeline, the waterfall, consoles and link budgets, with the Inspector for whichever node is selected.
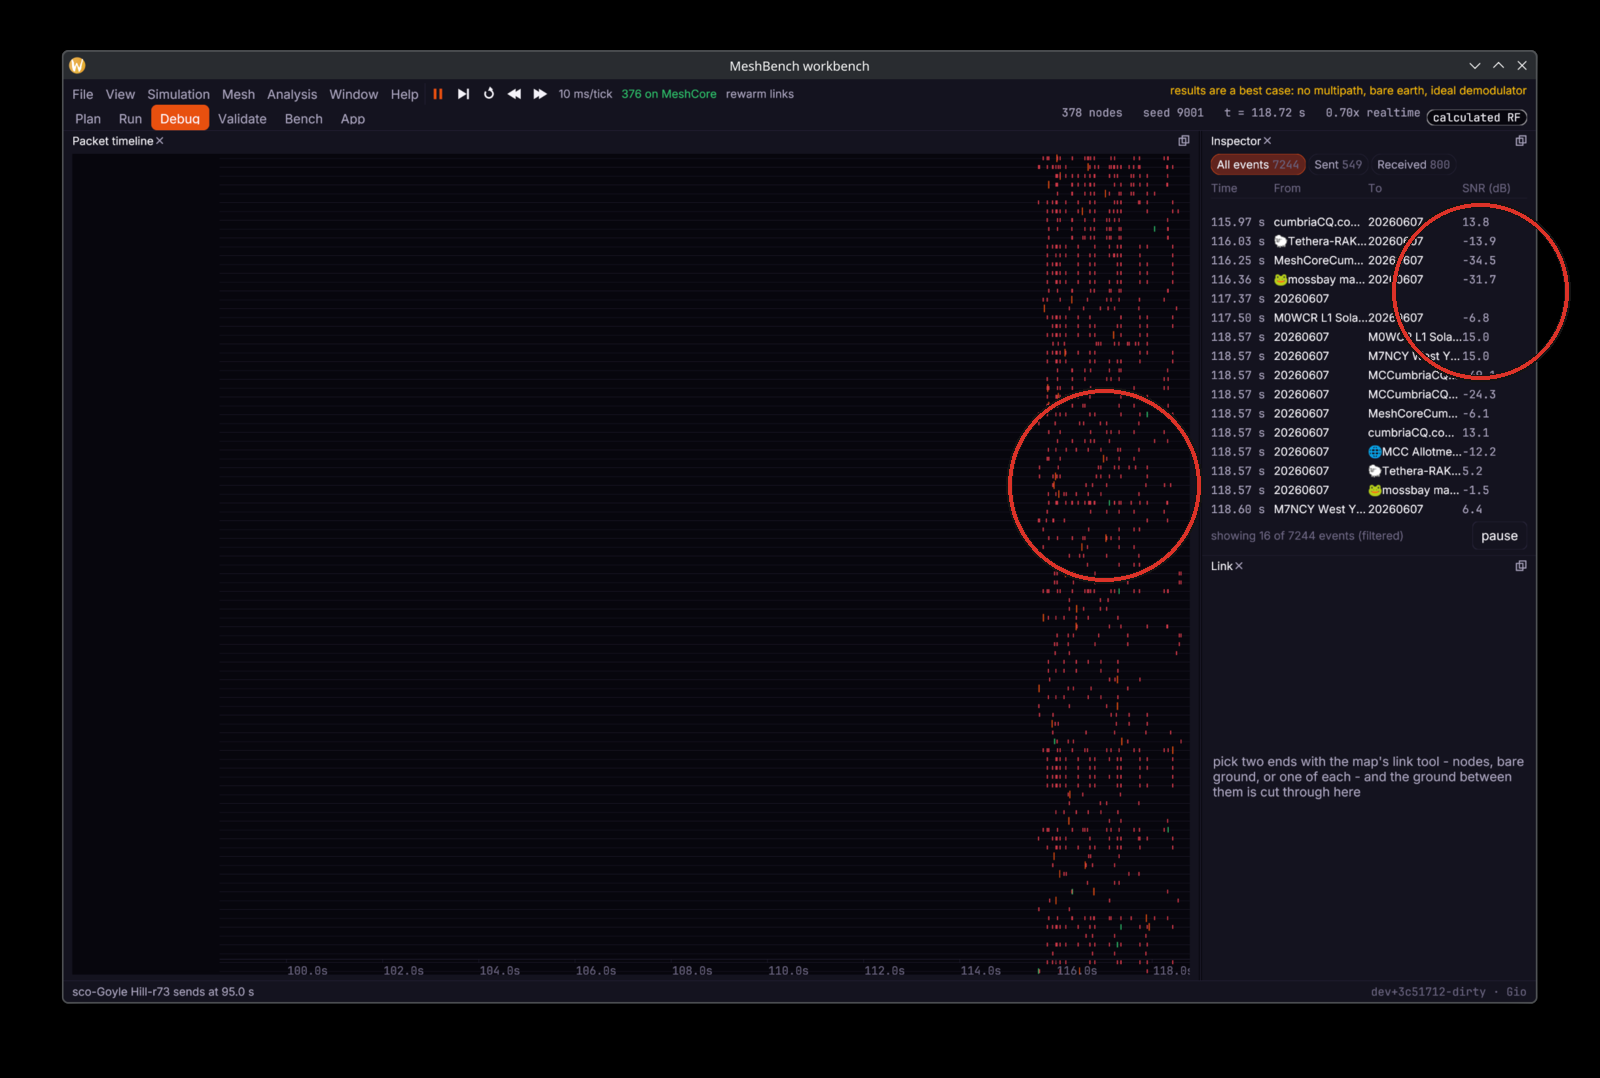
The causes, and what each means#
| cause | what happened | what to change |
|---|---|---|
| below the demodulator floor | the signal arrived, too weak to decode | height, power, antenna, or a lower spreading factor |
| corrupted by overlap | another transmission arrived at the same time | timing, offered load, relays; and re-run in waveform mode before trusting it: calculated mode has no capture effect and overstates collision loss |
| radio was elsewhere | the node was transmitting or on another frequency | scheduling, duty cycle |
| no route | nothing relayed it | regions, flood_max, loop detection |
| dropped by region | the node does not hold the scope | the region map, or the scope being sent on |
"It did not arrive" and "it arrived 3 dB under the floor" lead to completely different fixes, which is why the cause is recorded rather than a boolean.
Working backwards from a missing delivery#
- Did anybody transmit it? The Events panel filtered to the origin. If there is no transmission, the problem is above the radio: firmware, scope, or a node that is not running.
- Did a neighbour hear it? Receptions at one hop. If not, it is a link budget question: check the Link panel for that pair, in both directions.
- Did the neighbour relay it? A reception without a following transmission means the firmware decided not to forward. The usual reasons are the region map, the hop ceiling, and loop detection; Testing a repeater walks setting one node right.
- Ask the node.
console.typeruns a line on its own CLI and returns what it said, which is the difference between what you configured and what it believes.
Reachability is asymmetric#
A can hear B while B cannot hear A: different antennas, heights, powers and noise figures on each end. The Link panel reports both directions, and a result that gives one number for "the link" is hiding half the answer.
Capture the packets#
Simulation, then Capture to a pcapng file - or Watch it live in Wireshark, which starts the stream, installs the dissector and opens Wireshark as one action. Stop capturing ends either.
{"id":1,"method":"capture.file","params":{"path":"/tmp/run.pcapng"}}wb.call("capture.file", {"path": "/tmp/run.pcapng"})_, err := wb.Call(ctx, "capture.file", map[string]any{"path": "/tmp/run.pcapng"})The file is pcapng, which Wireshark reads with the MeshCore dissector in tools/dissector/; capture.wireshark is the live stream the menu entry uses.
Capture is started per session, not per run. A sweep rebuilds the engine between runs and the capture survives that, but a restarted workbench has no capture until one is started again.
Common causes that produce no error#
- Regions inferred but never applied. Everything transmits, nothing relays.
- A scope written without its hash. Every repeater derives a different key and declines.
- A node with no firmware version. Resolves to a build that is not published.
- Saved node preferences from an earlier run. A changed default never takes effect because the node loads its stored value.